The Fuzzle database contains many more hits than unique domains.
For example, 28 010 domains are involved in 8 109 195 hits for the database SCOPe2.06.
Therefore, many domains present different alignments
at plausibly different regions of their sequence. As an example, domain
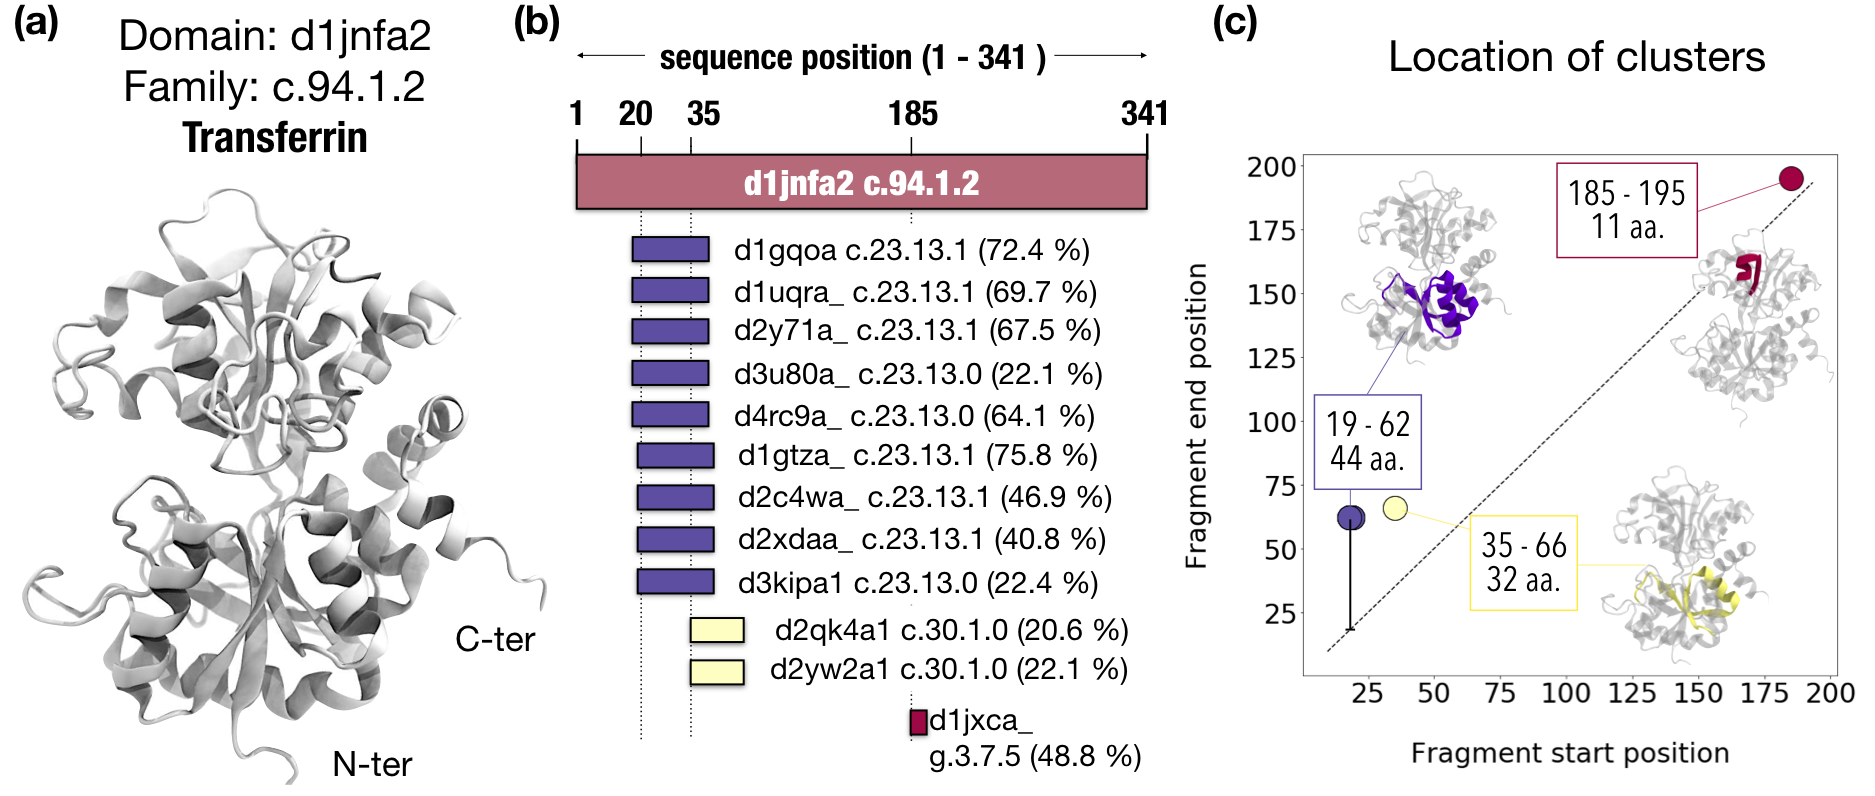
d1jnfa2, which belongs to the family c.94.1.2 ,
appears in 12 hits with domains that belong to folds other than c.94.
In particular, these 12 partners to whom d1jnfa2 aligns belong to three different folds (see fig below):
The alignments start and end at different positions in d1jnfa2 sequence,
mostly in the N-terminal region.
We used a density-based clustering method,
DBSCAN ,
and these 12 regions clustered into 3 fragments.
We applied this procedure to all the domains in the dataset.
Clustering of each domain in Fuzzle. Showing as
an example transferrin (a) which appears in Fuzzle in 12 hits with domains of other folds
(b).
The alignments with this domains occur at different start and end positions. Depicted are also
the family they belong to and in parenthesis the HHsearch probability.
The clustering takes into
account this position and lumps together domains with similar regions (c)
As a default, we always use the same parameters to plot our networks. The user may specify
custom parameters in many instances, but, unless otherwise specified, the parameters are as follows:
Other thresholds that could apply depending on the network are: include a specific query,
include specific folds, or force the hits to occur between folds of different classes, depending on the network (see below).
By definition, each Fuzzle hit consists of a fragment between two domains.
Given that each query and subject belong to a specific cluster, the fragment is also shared among all domains in the two clusters.
To find other possible clusters that contain the same fragment,
we built protein similarity networks where each node represents
a domain cluster and the links connect nodes that appear in the same hits.
Thus, in our networks, the nodes represent domains, and the links
connect domains with a fragment in common.
Every connected component, or in other words, a subgraph in which any two vertices are connected to each other by paths
(see more details),
represents a set of domains
that have a fragment in common.
Domain-centered networks
The domain-centered networks in Fuzzle represent precisely the domain clusters (see above),
like in this example: cobalamine binding domain.
The domain is at the center of each connected component (or subgraph) with a number that indicates
the cluster ID. The panel to the left shows the fragments in the structure when
clicking to their corresponding identifiers. The panel to the right shows a superimposition of two
structures when clicking into any link in the graph. The structures correspond to those nodes the link connects,
and the fragment they share is depicted in a different color.
Networks between two SCOPe groups
We can also represent the connections within domains of two different SCOPe groups.
For example, we may be interested in visualizing connections between the
TIM-barrels (c.1) and the ATC-like (c.78) folds. The different connected components represent
fragments that the TIM-barrels and the ATC-like present in common in different parts of their sequences.
Network of the protein space
We filtered the set of fuzzle hits that presented surpassed the thresholds defined
above (General considerations), plus reinforcing that the domains on each hit belong to different folds.
This final subset contained 8288 unique domains that were involved in 208944 hits. The input matrix contained 24 999 unique domain clusters.
We created a network that represented this 24 999 nodes linking them whenever they present a fragment in common.
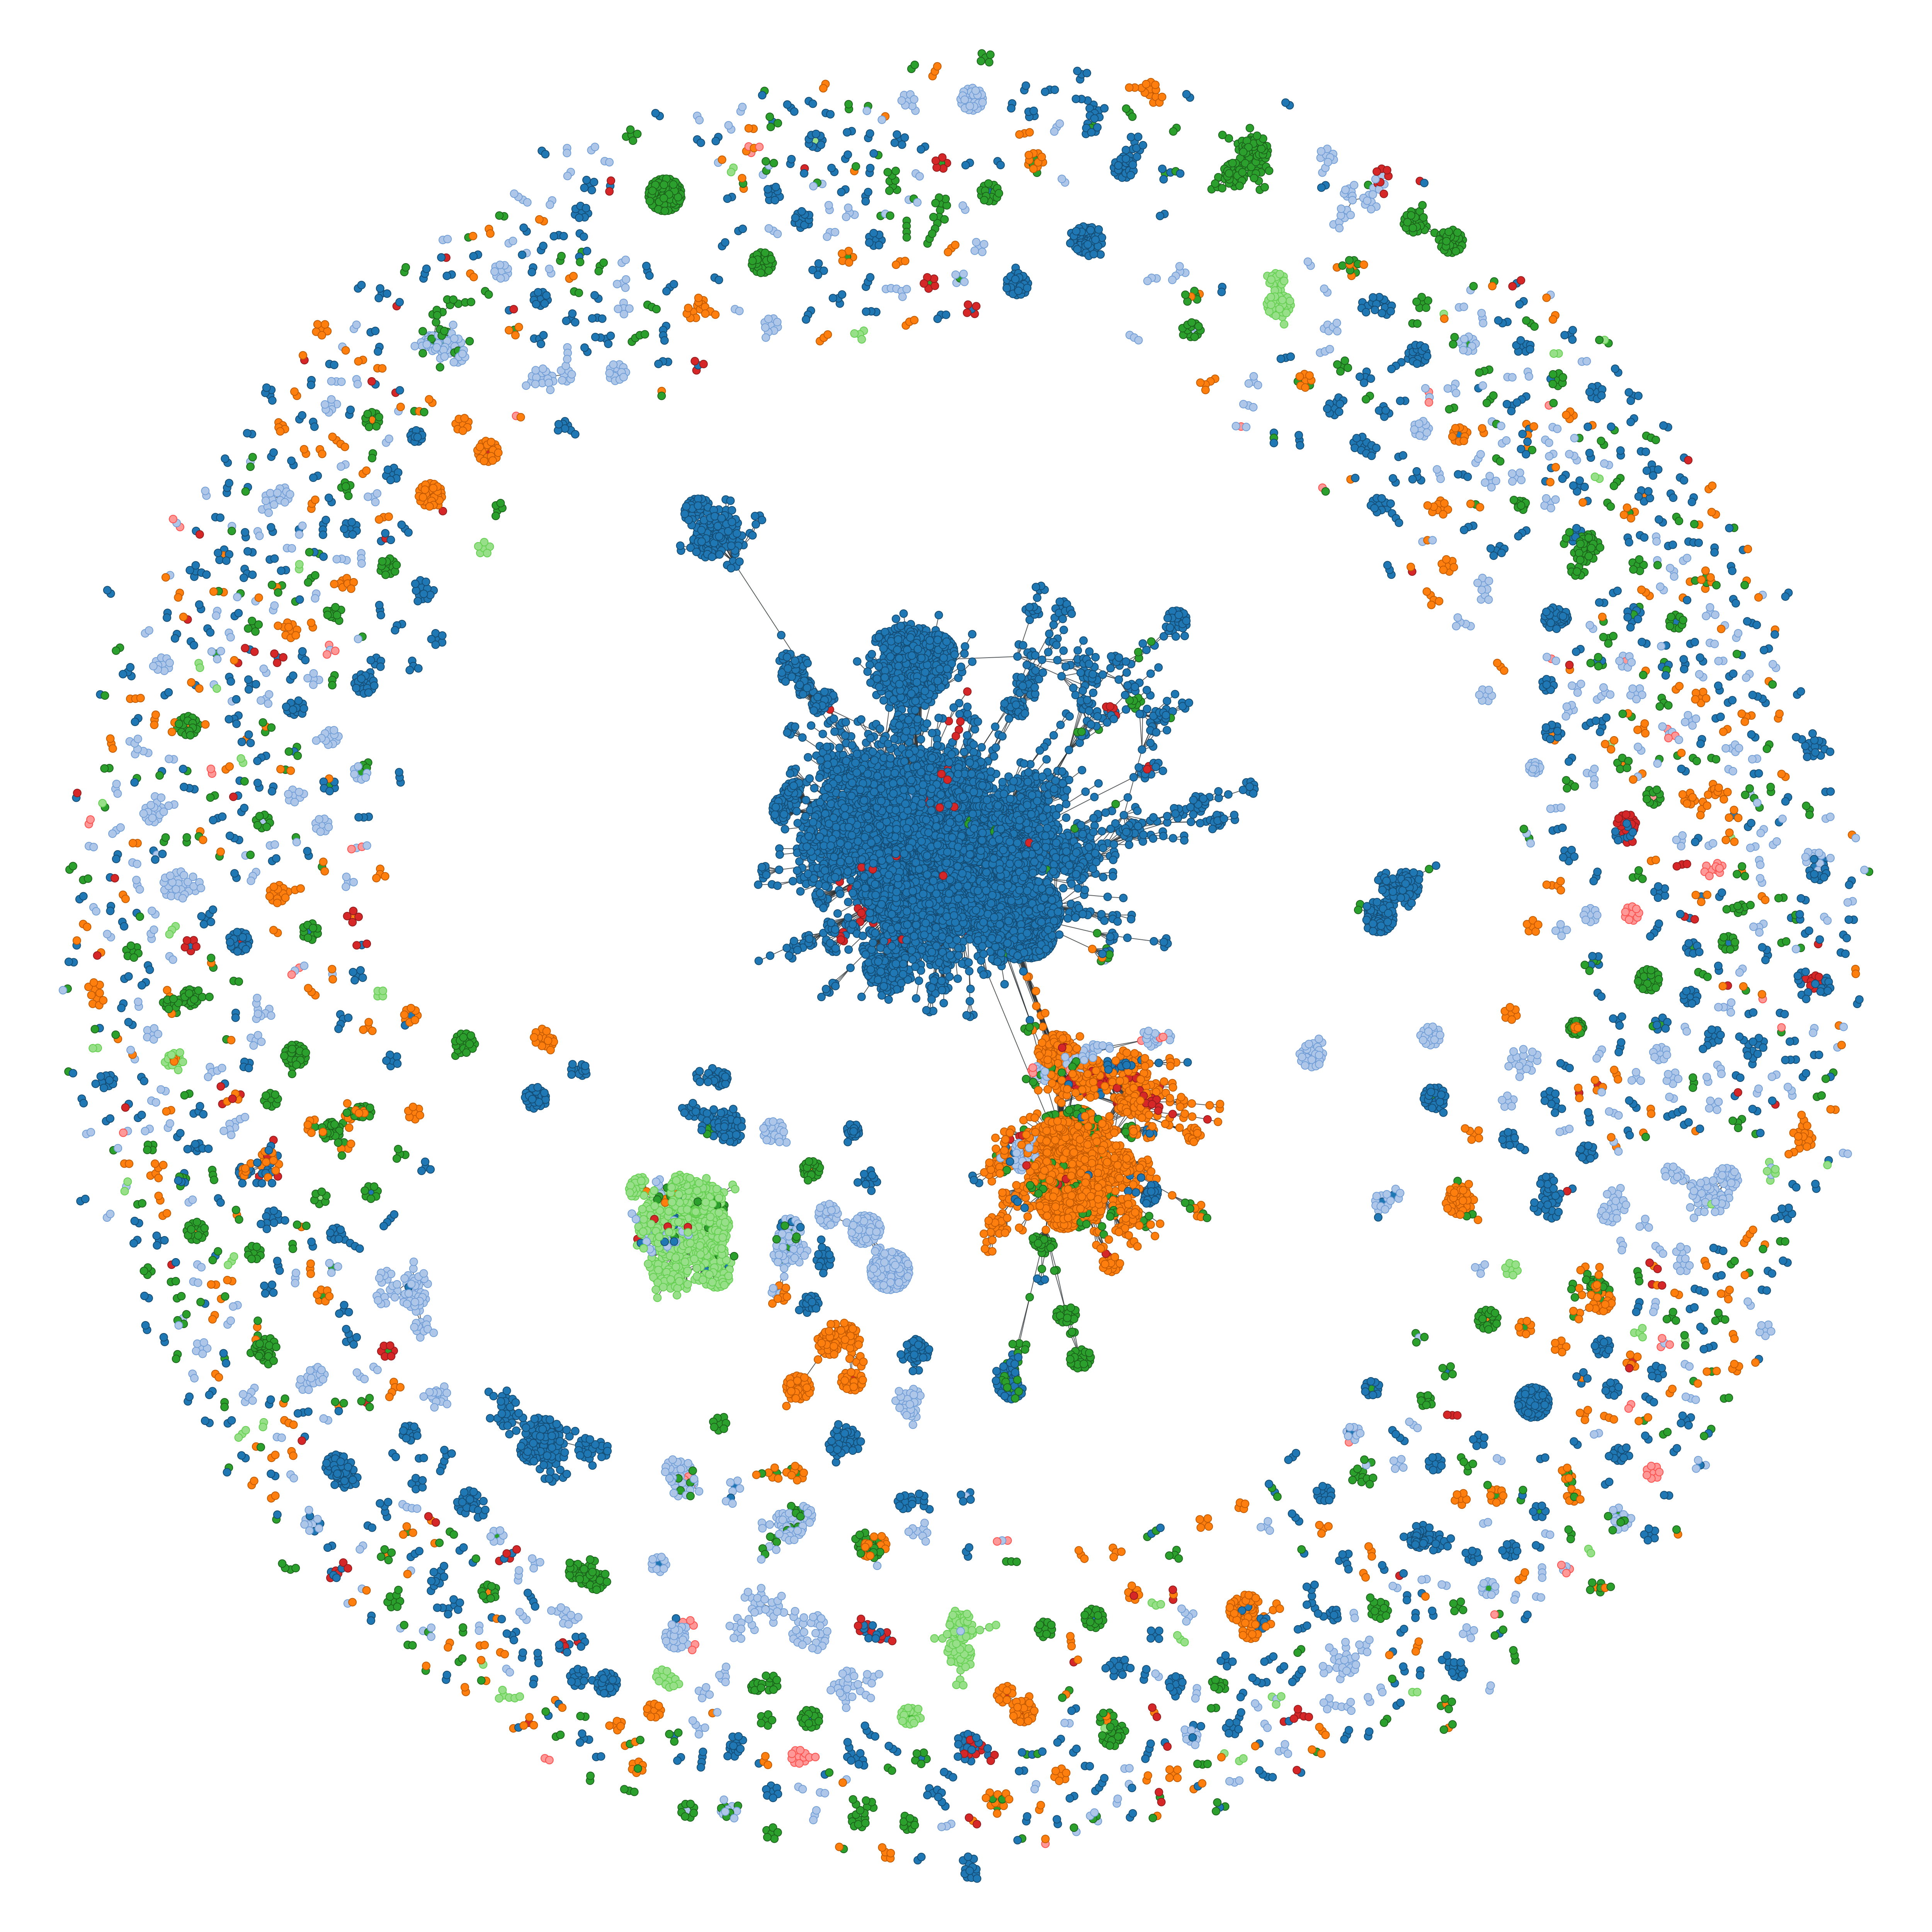
We obtain a network that is undirected, unweighted, and each pair of nodes are at most connected by one link, thus being a so-called simple network:
View of the universe colored by class. Each node
represents a protein domain and links connect domains that share a fragment in common.
The 24999 nodes are linked by 162852 links.
There are domains from the 7 classes in Fuzzle,
with varying proportions: 16.3 % belong to the SCOPe class a,
13.3 % to b, 45.2 % to c, 15.3% to d, 1.2% to e, 0.3 % to f, and 8.4 % to g.
There is not always a path between any two random vertices in the network,
and therefore the network is disconnected. In fact, as mentioned above,
we intended to build a disconnected network, such as
every connected component
represents a fragment that is shared among proteins of different folds.
The network presents 1337 fragments that span over 519 folds,
with average lengths ranging from 11 to 198 amino acids.
We have represented this network here.
In this representation, each connected component or fragment is represented by a node. By clicking on
that node, the domains that contain that fragment become visible. Clicking to all nodes in the figure above would
render the same figure. It is possible to visualize each fragment separately like for example
fragment 14.
Customizable networks
It is also possible in FUZZLE to visualize regions of the protein space with custom-defined paratemeters (see default
parameters in General Considerations). The result is like in the above section,
a set of nodes that represent a fragment, that when double clicking, expands
the domains that contain that fragment.
Bear in mind that depending on the chosen parameters rendering times might take long.
Coloring schema
We follow the same coloring schema through the whole web. That means that whenever fold c.1 is specified in a network
it will be represented as color blue. Superfamilies within fold c.1 all have different colors.
You can always get more information in the page you are visualizing the network, or a full list of the color schema
here.